Surveillance des notifications WIS2
Résultats d'apprentissage
À la fin de cette session pratique, vous serez capable de :
- déclencher le flux de travail wis2box en téléchargeant des données dans MinIO en utilisant la commande
wis2box data ingest - voir les avertissements et les erreurs affichés dans le tableau de bord Grafana
- vérifier le contenu des données publiées
Introduction
Le tableau de bord Grafana utilise des données de Prometheus et Loki pour afficher l'état de votre wis2box. Prometheus stocke les données de séries chronologiques issues des métriques collectées, tandis que Loki stocke les journaux des conteneurs en cours d'exécution sur votre instance wis2box. Ces données vous permettent de vérifier la quantité de données reçues sur MinIO et le nombre de notifications WIS2 publiées, et de détecter les erreurs éventuelles dans les journaux.
Pour voir le contenu des notifications WIS2 qui sont publiées sur différents sujets de votre wis2box, vous pouvez utiliser l'onglet 'Monitor' dans le wis2box-webapp.
Préparation
Cette section utilisera le jeu de données "surface-based-observations/synop" précédemment créé dans la session pratique Configuration des jeux de données dans wis2box.
Connectez-vous à votre VM étudiante en utilisant votre client SSH (PuTTY ou autre).
Assurez-vous que wis2box est opérationnel :
cd ~/wis2box-1.0.0rc1/
python3 wis2box-ctl.py start
python3 wis2box-ctl.py status
Assurez-vous que MQTT Explorer est en cours d'exécution et connecté à votre instance en utilisant les identifiants publics everyone/everyone avec un abonnement au sujet origin/a/wis2/#.
Assurez-vous d'avoir accès à l'interface web MinIO en allant sur http://<your-host>:9000 et que vous êtes connecté (en utilisant WIS2BOX_STORAGE_USERNAME et WIS2BOX_STORAGE_PASSWORD de votre fichier wis2box.env).
Assurez-vous d'avoir un navigateur web ouvert avec le tableau de bord Grafana pour votre instance en allant sur http://<your-host>:3000.
Ingestion de quelques données
Veuillez exécuter les commandes suivantes depuis votre session client SSH :
Copiez le fichier de données d'exemple aws-example.csv dans le répertoire que vous avez défini comme WI2BOX_HOST_DATADIR dans votre fichier wis2box.env.
cp ~/exercise-materials/monitoring-exercises/aws-example.csv ~/wis2box-data/
Assurez-vous que vous êtes dans le répertoire wis2box-1.0.0rc1 et connectez-vous au conteneur wis2box-management :
cd ~/wis2box-1.0.0rc1
python3 wis2box-ctl.py login
Vérifiez que les données d'exemple sont disponibles dans le répertoire /data/wis2box/ à l'intérieur du conteneur wis2box-management :
ls -lh /data/wis2box/aws-example.csv
Note
Le WIS2BOX_HOST_DATADIR est monté comme /data/wis2box/ à l'intérieur du conteneur de gestion wis2box par le fichier docker-compose.yml inclus dans le répertoire wis2box-1.0.0rc1.
Cela vous permet de partager des données entre l'hôte et le conteneur.
Exercice 1 : ingestion de données en utilisant wis2box data ingest
Exécutez la commande suivante pour ingérer le fichier de données d'exemple aws-example.csv dans votre instance wis2box :
wis2box data ingest -p /data/wis2box/aws-example.csv --metadata-id urn:wmo:md:not-my-centre:core.surface-based-observations.synop
Les données ont-elles été ingérées avec succès ? Sinon, quel était le message d'erreur et comment pouvez-vous le corriger ?
Cliquez pour révéler la réponse
Vous verrez l'affichage suivant :
Error: metadata_id=urn:wmo:md:not-my-centre:core.surface-based-observations.synop not found in data mappings
Le message d'erreur indique que l'identifiant de métadonnées que vous avez fourni ne correspond à aucun des jeux de données que vous avez configurés dans votre instance wis2box.
Fournissez l'identifiant de métadonnées correct qui correspond au jeu de données que vous avez créé lors de la session pratique précédente et répétez la commande d'ingestion des données jusqu'à ce que vous voyiez l'affichage suivant :
Processing /data/wis2box/aws-example.csv
Done
Allez dans la console MinIO dans votre navigateur et vérifiez si le fichier aws-example.csv a été téléchargé dans le seau wis2box-incoming. Vous devriez voir qu'il y a un nouveau répertoire avec le nom du jeu de données que vous avez fourni dans l'option --metadata-id :

Note
La commande wis2box data ingest a téléchargé le fichier dans le seau wis2box-incoming de MinIO dans un répertoire nommé d'après l'identifiant de métadonnées que vous avez fourni.
Allez dans le tableau de bord Grafana dans votre navigateur et vérifiez l'état de l'ingestion des données.
Exercice 2 : vérifier l'état de l'ingestion des données
Allez dans le tableau de bord Grafana dans votre navigateur et vérifiez l'état de l'ingestion des données.
Les données ont-elles été ingérées avec succès ?
Cliquez pour révéler la réponse
Le panneau en bas du tableau de bord d'accueil de Grafana signale les avertissements suivants :
WARNING - input=aws-example.csv warning=Station 0-20000-0-60355 not in station list; skipping
WARNING - input=aws-example.csv warning=Station 0-20000-0-60360 not in station list; skipping
Cet avertissement indique que les stations ne sont pas définies dans la liste des stations de votre wis2box. Aucune notification WIS2 ne sera publiée pour cette station jusqu'à ce que vous l'ajoutiez à la liste des stations et l'associiez au sujet de votre jeu de données.
Exercice 3 : ajouter les stations de test et répéter l'ingestion des données
Ajoutez les stations à votre wis2box en utilisant l'éditeur de stations dans wis2box-webapp, et associez les stations au sujet de votre jeu de données.
Téléchargez à nouveau le fichier de données d'exemple aws-example.csv dans le même chemin dans MinIO que vous avez utilisé lors de l'exercice précédent.
Vérifiez le tableau de bord Grafana, y a-t-il de nouvelles erreurs ou avertissements ? Comment pouvez-vous voir que les données de test ont été ingérées et publiées avec succès ?
Cliquez pour révéler la réponse
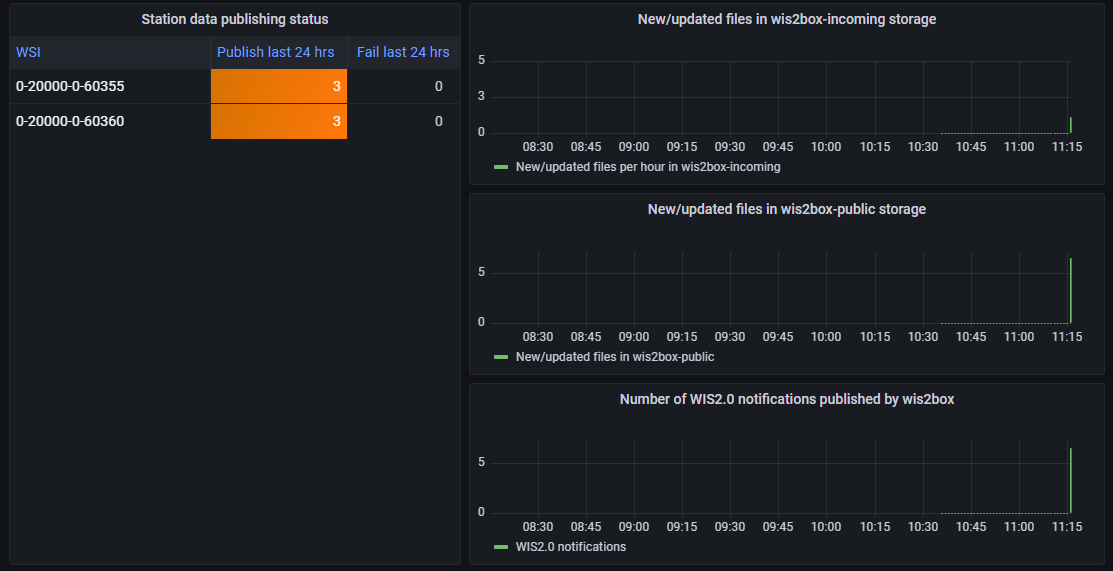
Vous pouvez vérifier les graphiques sur le tableau de bord d'accueil de Grafana pour voir si les données de test ont été ingérées et publiées avec succès.
Si cela a réussi, vous devriez voir ce qui suit :

Exercice 4 : vérifier le courtier MQTT pour les notifications WIS2
Allez dans l'Explorateur MQTT et vérifiez si vous pouvez voir le Message de Notification WIS2 pour les données que vous venez d'ingérer.
Combien de notifications de données WIS2 ont été publiées par votre wis2box ?
Comment accédez-vous au contenu des données publiées ?
Cliquez pour révéler la réponse
Vous devriez voir 6 notifications de données WIS2 publiées par votre wis2box.
Pour accéder au contenu des données publiées, vous pouvez développer la structure du sujet pour voir les différents niveaux du message jusqu'à atteindre le dernier niveau et examiner le contenu du message de l'un des messages.
Le contenu du message comporte une section "liens" avec une clé "rel" de "canonical" et une clé "href" avec l'URL pour télécharger les données. L'URL sera au format http://<your-host>/data/....
Notez que le format des données est BUFR et vous aurez besoin d'un analyseur BUFR pour visualiser le contenu des données. Le format BUFR est un format binaire utilisé par les services météorologiques pour échanger des données. Les plugins de données à l'intérieur de wis2box ont transformé les données de CSV en BUFR avant de les publier.
Visualisation du contenu des données que vous avez publiées
Vous pouvez utiliser le wis2box-webapp pour visualiser le contenu des notifications de données WIS2 qui ont été publiées par votre wis2box.
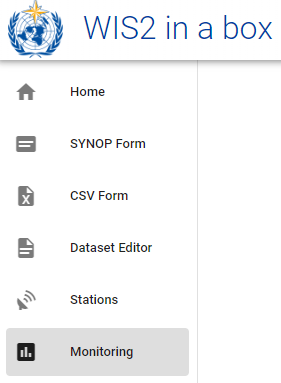
Ouvrez le wis2box-webapp dans votre navigateur en naviguant sur http://<your-host>/wis2box-webapp et sélectionnez l'onglet Monitoring :

Dans l'onglet de surveillance, sélectionnez votre identifiant de jeu de données et cliquez sur "UPDATE"
Exercice 5 : visualiser les notifications WIS2 dans le wis2box-webapp
Combien de notifications de données WIS2 ont été publiées par votre wis2box ?
Quelle est la température de l'air rapportée dans la dernière notification à la station avec l'identifiant WIGOS=0-20000-0-60355 ?
Cliquez pour révéler la réponse
Si vous avez ingéré avec succès les données de test, vous devriez voir 6 notifications de données WIS2 publiées par votre wis2box.
Pour voir la température de l'air mesurée pour la station avec l'identifiant WIGOS=0-20000-0-60355, cliquez sur le bouton "INSPECT" à côté du fichier pour cette station pour ouvrir une fenêtre contextuelle affichant le contenu analysé du fichier de données. La température de l'air mesurée à cette station était de 25,0 degrés Celsius.
Note
Le conteneur wis2box-api comprend des outils pour analyser les fichiers BUFR et afficher le contenu dans un format lisible par l'homme. Ce n'est pas une exigence de base pour l'implémentation WIS2.0, mais a été inclus dans le wis2box pour aider les éditeurs de données à vérifier le contenu des données qu'ils publient.
Conclusion
Félicitations !
Dans cette session pratique, vous avez appris à :
- déclencher le flux de travail wis2box en téléchargeant des données dans MinIO en utilisant la commande
wis2box data ingest - voir les notifications WIS2 publiées par votre wis2box dans le tableau de bord Grafana et l'Explorateur MQTT
- vérifier le contenu des données publiées en utilisant le wis2box-webapp